ScaleSec contributed a tutorial to the Google Cloud Community titled “Exporting Stackdriver Logs to Elastic Cloud”
Those responsible for keeping data safe in the cloud need visibility of security-related events taking place in their workloads. For example, a seemingly benign oversight like an overly-wide firewall rule can have significant impact to an organization’s security posture, and problems with VPN tunnels can cause unexpected outages. Getting the events flowing to a log analytics system like Splunk Cloud or Elastic Stack (a.k.a. “ELK”) is a step toward minimizing the time it takes to discover and remediate a risky scenario.
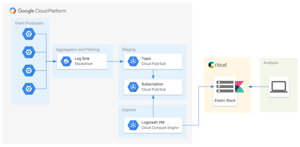
Google Cloud Platform customers can use Stackdriver for near real-time logging of activity in the cloud, as well as logs from resources in AWS and data centers. While Stackdriver Log Viewer provides a cloud-native feature to perform log searching, filtering, alerting, exporting, and more, we can also send the logs to an existing logging solution to leverage pre-existing investments. The tutorial uses Logstash to pull messages containing the logs from a Cloud Pub/Sub topic. Logstash then forwards those messages to the Elasticsearch database.
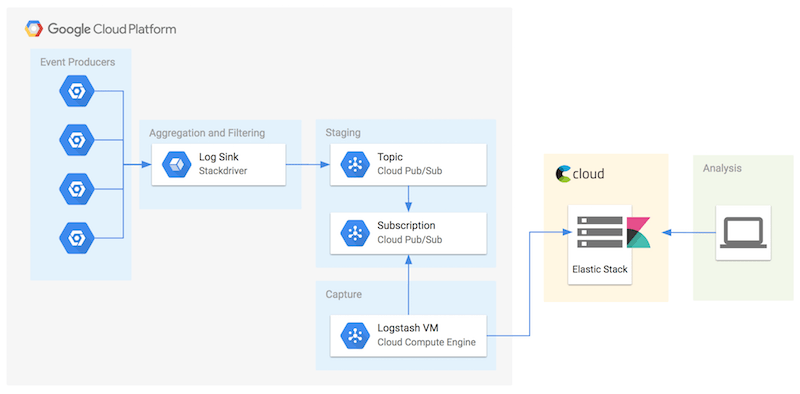
Use Logstash and Cloud Pub/Sub to send Stackdriver logs to Elastic Cloud
The tutorial may also be useful for those that elect to build their own Security Information and Event Management (SIEM) solution or Elastic Stack instead of using the Elastic Cloud SaaS offering. Ask your friendly security expert for guidance on this choice to prevent sadness. When considering SaaS solutions, it is especially important to involve compliance team early if you need to meet requirements from HIPAA, PCI, SOC 2, FedRAMP, or the like. Vendor risk management is an important part of a mature compliance practice.
Regularly analyzing logs is a crucial component of mature security operations. After the logs are flowing, the next recommended step is to build content in Kibana to identify which events are important, and which ones need a quick response. While Elastic Cloud was used as an example in the tutorial, Stackdriver can be used to monitor resources using other logging architectures, other logging systems, other operating systems, and even other cloud providers.
— Aaron